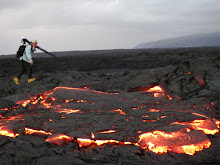
 “Photo of the Puhi-o-Kalaikini lava delta taken Thursday, Oct. 28, 2010, prior to the collapse. The red line shows the approximate inland boundary of the area that collapsed into the ocean Nov. 2. (Photo courtesy of USGS)”
On November 2nd at 5:30 in the morning I witnessed a spectacular event: the collapse of a broad section of the newly forming lava delta. I reported this event here on the 2nd with still photographs and then again on the 3rd with a video clip of the explosive display. But what I did not know was the amount of delta land fractured and fallen into the ocean that morning. We now have the answer.
A few days ago USGS posted an article written about the collapse and used the photo above to show how much land dropped on November 2nd. The article unfortunately made no mention of my still images or movie clip of the event.
 The photos above and below, both shot on the morning of Nov. 2nd, show the location I recorded the collapse at – where hot silvery lava meets green in these photos and in the USGS top image - where it borders the active lava bench. I was about 300 feet inland from the collapse and viewing it from there looking southeast across the bench's width.
  At the time I guesstimated the collapse at about 700 running feet along ocean side of the western delta edge and perhaps twenty feet out… Both the 700-feet long and 20-feet wide were way under the actual final estimate by USGS, which put it at about 1150 ft (350 m) long and up to 130 ft (40 m) wide --- No wonder it was so impressive witness, that’s a lot of land! (I remember I had an escape plan in my mind should the collapse progress inland – a remnant of the old 4wheel-drive Fisherman’s access road was directly behind me ;)
 You can watch the lava bench ripping apart on the original video reposted below:
--- Meanwhile the current lava flow update remains pretty consistent with the past week:
D/I (Deflation – Inflation) monitors continue reflecting little rise or fall compared to past scales used for presenting the variances of magma pressure. Notice the macro-scale of today’s graph (see the scale size along the left edge in each graph): -1 to +1.5 and that of Nov. 15th’s ranging from –4 to +4 right below.


At such a magnified range even the slightest movement graphs as a major swing. These movements are, as stated in the caption on the site above, in microradians, an angular measure in parts per million; for example, one microradian represents the tilt of a 1-km-long bar, one end of which is lifted up or down 1 mm. That said, today’s graph does show a divergence of magma pressure between Kilauea crater and Pu`u O`o, and may indicate the beginning of a broader change in magma reservoir pressures.
I have not been out to the coastal lava flow area for four days while I continue focusing on an ongoing movie project, but none of my friends out there or fellow lava junkies have reported anything other that the continued flow of lava into the ocean just southwest of Kalapana Gardens and highway 130 terminus access road, as well some small sporadic surface flow activity along remote sections of the lava tubes on the coastal plains.
For further information on lava viewing opportunities take a look at the overview I add at the bottom of this recent blog post here.
NOTE:
I will be posting lava updates a little less often so I can give more concentration to other photography projects, but I will for sure post any lava activity that warrants a report!
~~ Aloha,
Leigh


Aloha Leigh,
ReplyDeleteThe divergence in tilt since 11/14 is probably due to the large amount of rainfall at Pu`u `O`o. The NWS bulletin shows 2.7 inches in nearby Glenwood from 12pm 11/14 to 12pm 11/15. Thanks for the updates!
Phil, VolcanoDiscovery Hawai`i
That was very observant of you Phil ;) I think that is a good explanation, thanks for that,
ReplyDeleteLeigh